Overview
The Dashboard provides summary of operational and reservation performance for your property. This page serves as a quick reference for monitoring daily performance and identifying important trends at a glance.
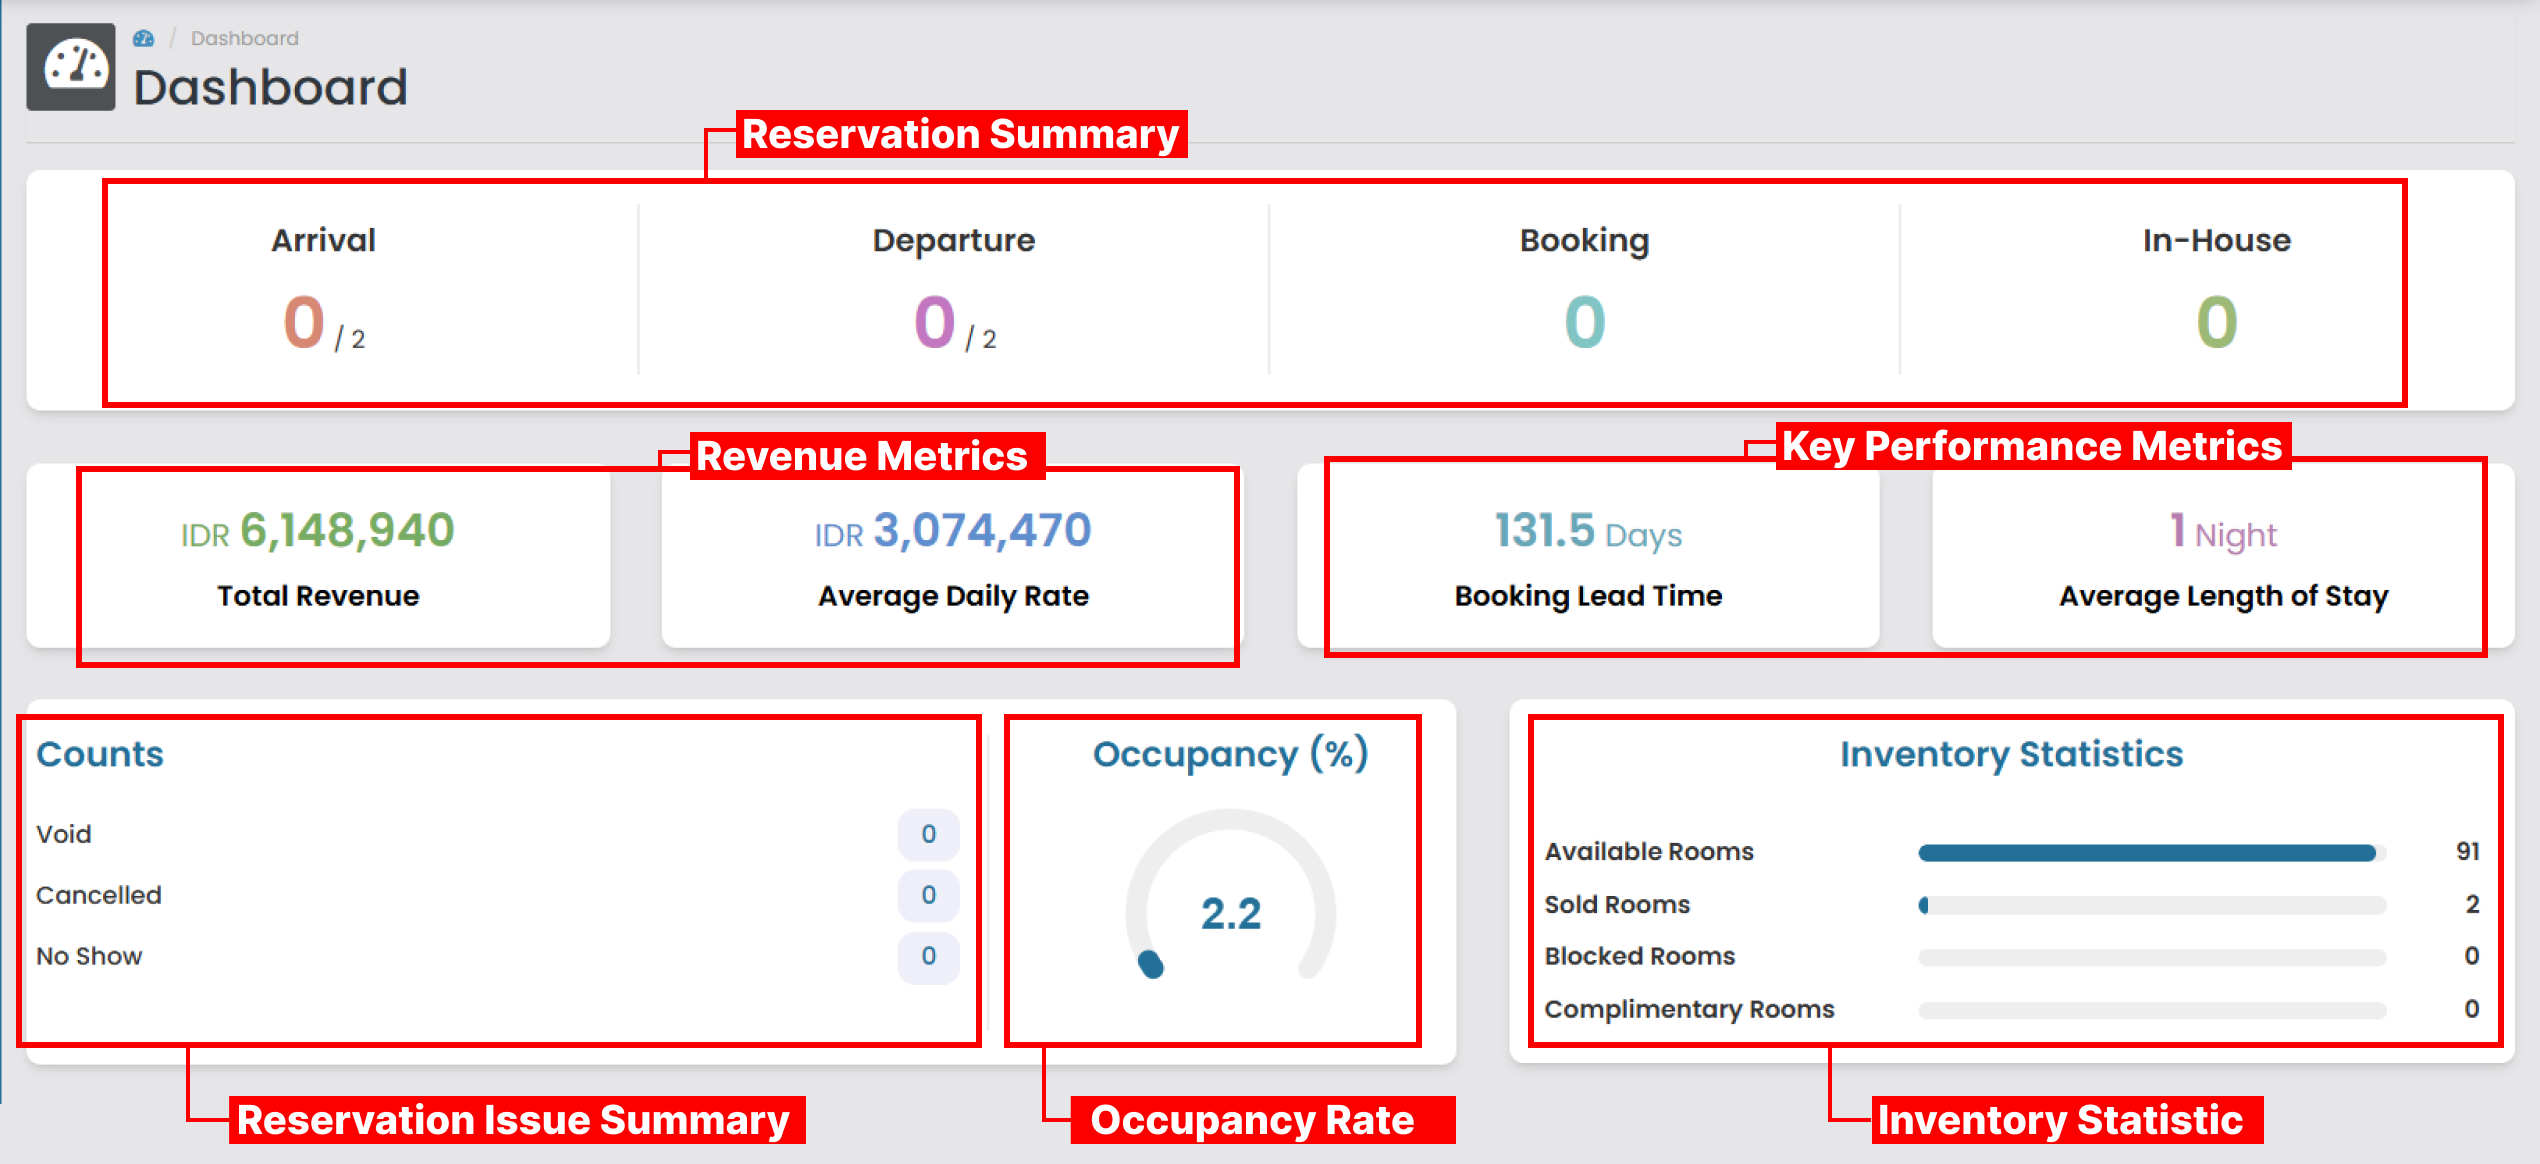
Reservation Summary
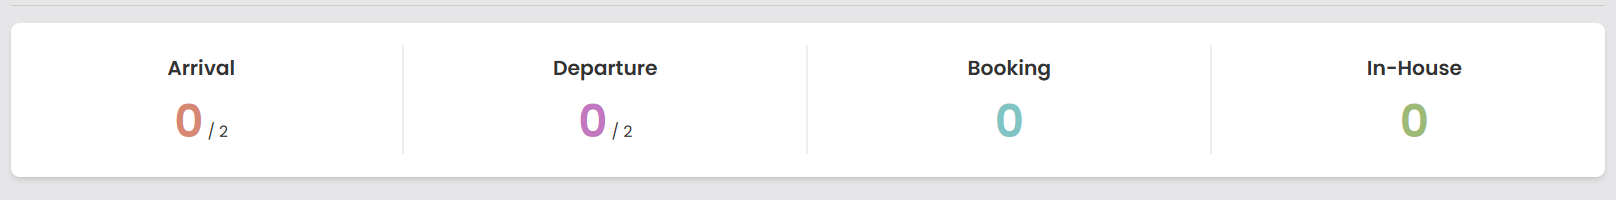 This section provides real-time counts of key guest activities for the current day.
- Arrival : Shows the number of guests have already checked in compared to the total number scheduled to arrive today. (e.g., 0/2 means 0 guests have checked in out of 2 expected arrivals)_.
- Departure : Shows the number of guests have already checked out compared to the total number scheduled to depart today.
- Booking : Displays the number of new reservations confirmed today.
- In-House : Indicates the total number of rooms currently occupied by guests.
Revenue Performance
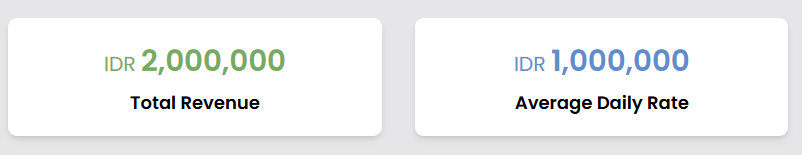 This section highlights essential room-related revenue indicators that help you understand how well the property is performing financially.
- Total Revenue
Shows the total income generated from room sales. - Average Daily Rate (ADR)
Indicates the average room rate earned per occupied room.
Key Performance Metrics
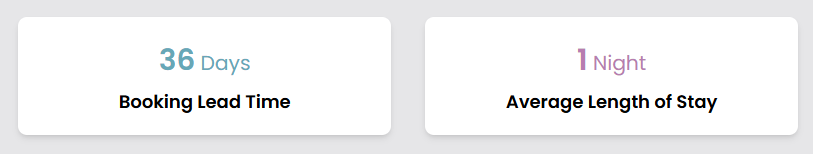 These indicators help analyze booking patterns and guest behavior, supporting forecasting and operational planning.
- Booking Lead Time The average number of days between the booking date and the guest’s arrival date. A longer lead time typically indicates stronger forward demand.
- Average Length of Stay (ALOS) The average number of nights guests stay in the property. It helps determine guest stay patterns, optimize room allocation, and improve revenue planning.
Reservation Issue Summary
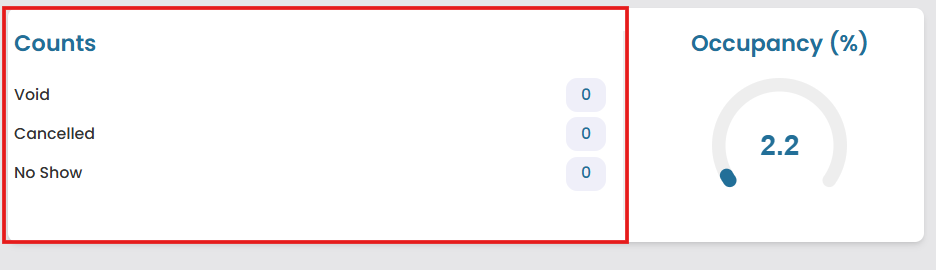 This section tracks reservation outcomes that do not generate revenue, helping assess revenue loss and optimize inventory usage.
- Void : The number of reservations permanently invalidated or removed from the system.
- Cancelled : The number of reservations formally cancelled by either the guest or the property.
- No Show : The number of guests who failed to arrive for their confirmed booking without prior cancellation.
Occupancy Rate
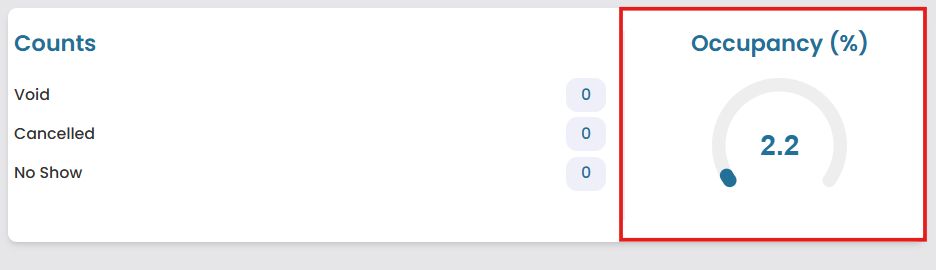 The Occupancy Rate section is displayed using a circular gauge to give a clear visual overview of how many rooms are currently occupied. A higher percentage means most rooms are occupied and the property is performing well in terms of room sales. This metric helps front office and management teams quickly assess current occupancy levels and make informed decisions related to staffing, inventory, upselling, and rate adjustments.
Inventory Statistic
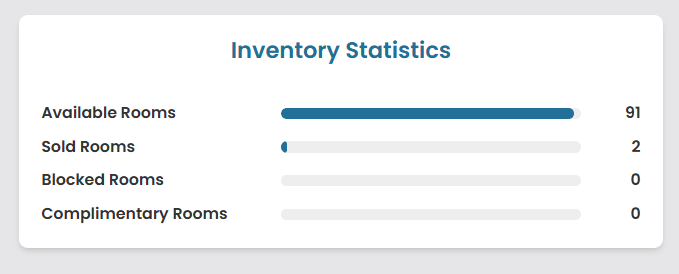 This chart provides a detailed breakdown of your current room inventory status:
- Available Rooms : The number of rooms ready to be sale.
- Sold Rooms : The number of rooms currently occupied by paying guests.
- Blocked Rooms : Rooms temporarily removed of inventory (eg, for maintenance, cleaning, or a group hold).
- Complimentary Rooms : Rooms occupied but provided at no charge (eg, staff, owner, promotional allotment).