Report
The Report menu provides a comprehensive overview of rating trends over time, drawn from multiple review platforms. This section helps you monitor performance and reputation through visualized statistics, detailed rating breakdowns, and service-specific feedback.
Reputation Report
The Reputation Report section visualizes rating data trends over time in the form of a line graph. It supports filtering and export features for in-depth analysis. You can show or hide Filter by click Hide Filter or Show Filter at the top of the section to collapse or expand the filter panel. The filter panel allows you to adjust the data displayed on the chart.
How to Filter Report
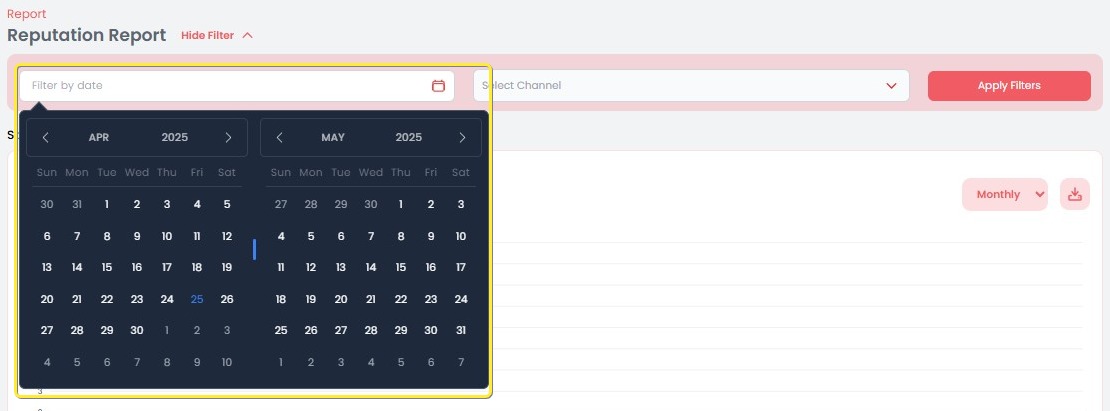
- Click Show Filter to show the filter panel.

- Select the Date Range by clicking the calendar input field.
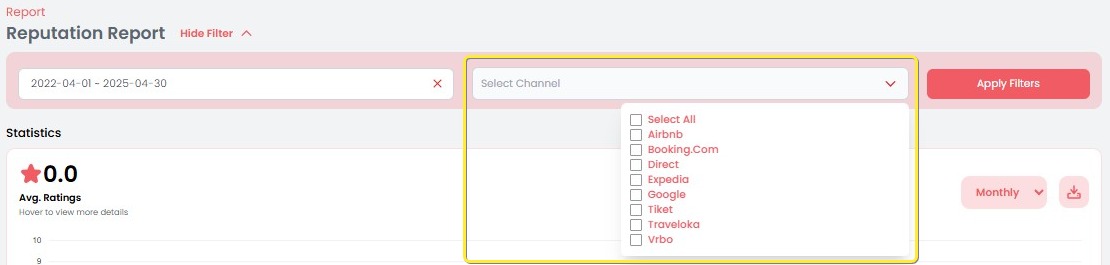
- Choose a Channel from the dropdown menu to view data from a specific platform (optional).
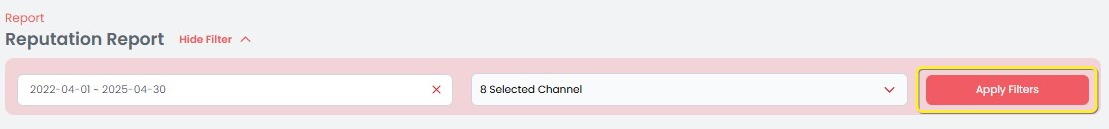
- Click the red Apply Filters button to update the chart based on your selections.
[!NOTE]
Troubleshooting Filter Report
No data appears after clicking Apply Filters
- Ensure the selected date range includes available review data.
- Check if the selected channel has data within the chosen date range.
Channel dropdown does not show any options
- Refresh the page and try reopening the filter panel.
- Make sure your internet connection is stable.
Apply Filters button is unclickable
- Ensure at least one filter has been selected (e.g., date range or channel).
- Collapse and reopen the filter panel, then reapply your selection.
Filtered data does not update
- Try clearing your browser cache or opening the page in incognito mode.
- Reapply the filters and ensure no conflicting filters are still active.
Statistics
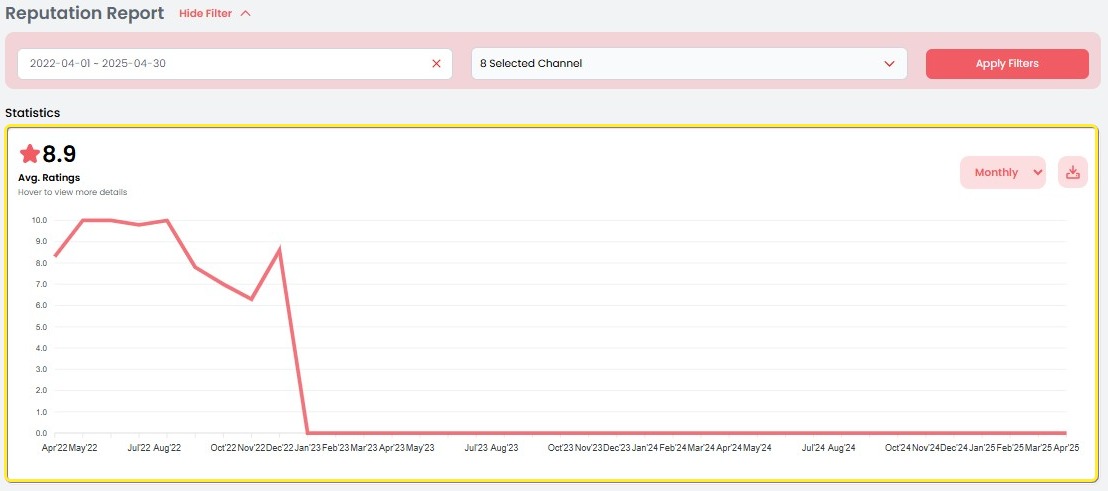
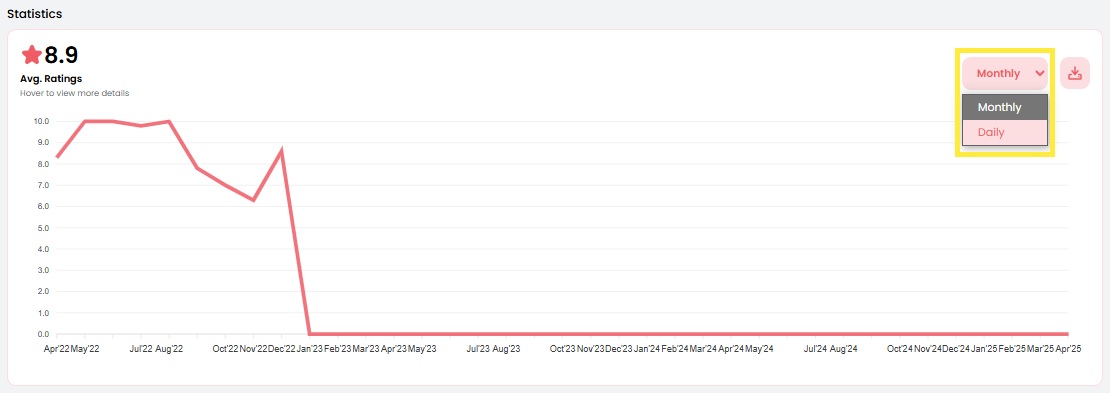
The Statistics chart displays the average rating over time. You can analyze rating trends by switching between Monthly or Daily views.
- The average rating is displayed on the left with a star icon.
- Hover over each point in the line graph to see the exact average rating on that date or month.
Switch Between Monthly / Daily
- Use the dropdown at the top-right of the chart to toggle between Monthly and Daily data views.
- This allows you to see trends over different time intervals.
How to Export Statistics
- Click the download icon (downward arrow) at the top-right of the Statistics chart.
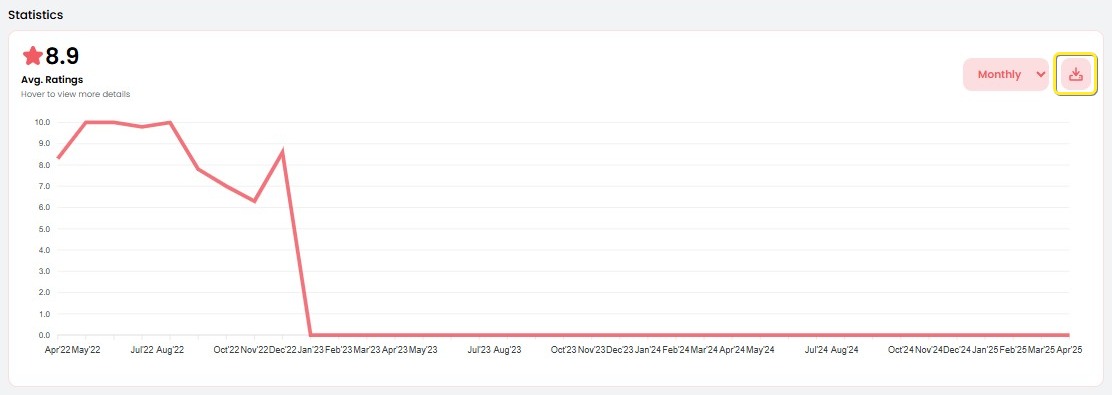
- Choose between Export to CSV or Export to PNG.
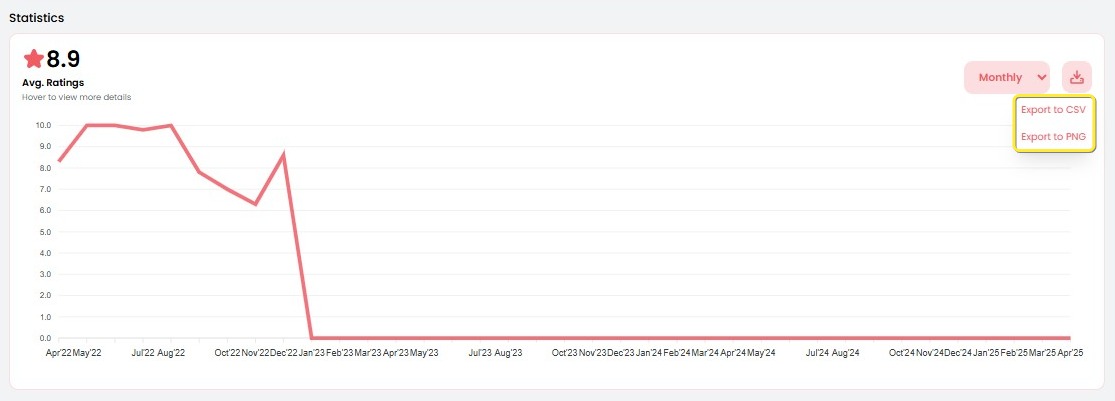
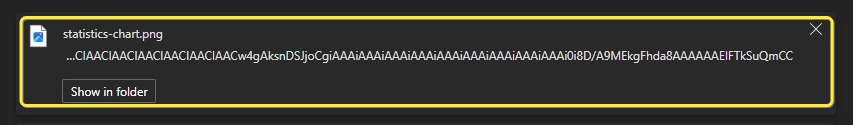
- The chart will be downloaded to your device in the selected format.
[!NOTE]
Troubleshooting Statistics
Chart does not load or appears blank
- Make sure a valid date range and channel have been selected.
- Try refreshing the page to reload the data.
Dropdown to switch between Monthly/Daily is missing
- Ensure the chart section is fully loaded before interacting.
- Try zooming out your browser or reloading the page.
Chart values look incorrect or incomplete
- The selected time range may not have enough data to show full trends.
- Try adjusting the date range to include more data points.
Download icon not responding
- Wait a few seconds after the chart loads before clicking the icon.
- Make sure your browser allows downloads and pop-ups.
Exported file is empty or broken
- Reload the chart and try exporting again.
- If the issue persists, try exporting in another format (e.g., CSV instead of PNG).
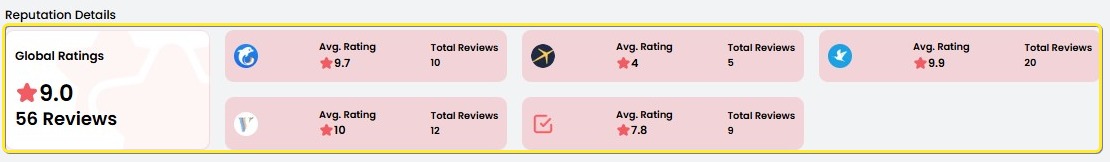
Reputation Details
The Reputation Details section summarizes average ratings and review counts by channel.
- Displays the Global Rating and Total Reviews across all channels.
- Each channel includes:
- Channel Icon
- Average Rating
- Total Number of Reviews
- This section helps compare performance across different platforms.
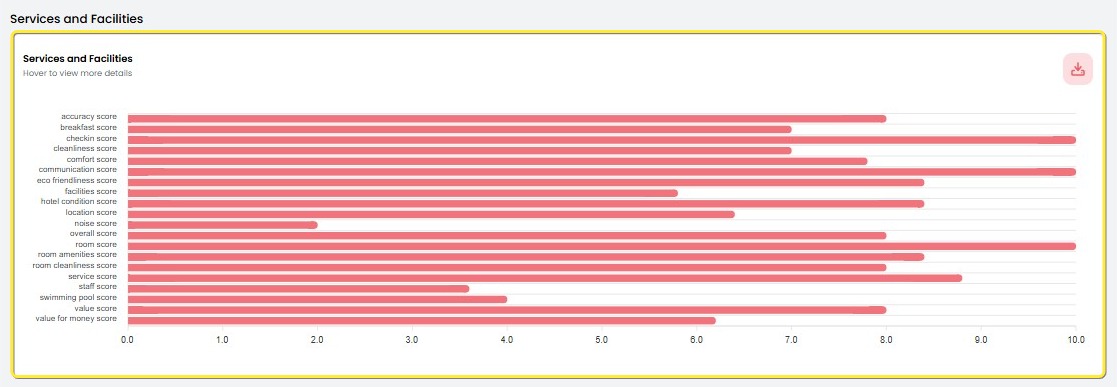
Services and Facilities
The Services and Facilities chart presents average ratings per service category (e.g., cleanliness, location, value for money).
- Each bar represents the average score of a specific category.
- Hover over each bar to see the precise score.
- This helps you identify which service areas are rated highest or need improvement.
How to Export Services and Facilities
- Click the download icon at the top-right corner of the Services and Facilities chart.
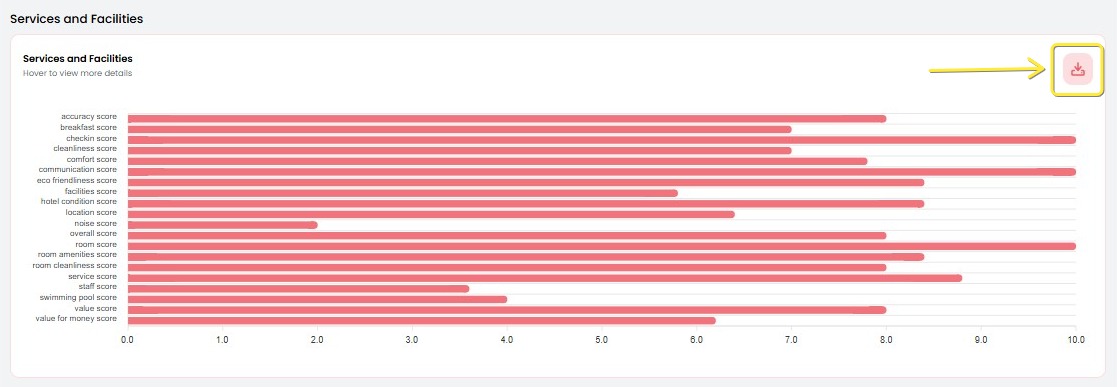
- Choose either Export to CSV or Export to PNG.

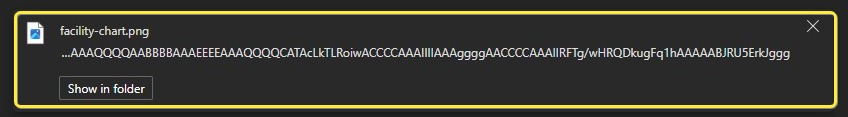
- The chart will be downloaded to your device in the selected format.
[!NOTE]
Troubleshooting Services and Facilities
Chart does not display or loads incompletely
- Ensure the page is fully loaded and filters are correctly applied.
- Refresh the page if the chart fails to render.
Bar values are missing or inaccurate
- Some categories may not have enough data to calculate an average.
- Expand the date range or include more channels to display results.
Hover tooltip not showing on bars
- Move your cursor directly over the bar to trigger the tooltip.
- Try adjusting your screen zoom or browser window size.
Download icon not clickable
- Wait until the chart is fully rendered before clicking the download icon.
- Ensure no browser extensions are blocking UI elements.
Exported file is blank or cannot be opened
- Re-export using a different format (CSV or PNG).
- Verify that your device supports the selected file type and try again.