Introduction
The Logs feature provides a centralized view of all recorded activities within the system, including logs from multiple sources such as OTA connections, process failures, process queues, PMS synchronization, and user actions. This helps users monitor, analyze, and troubleshoot system operations effectively.
Activity Logs Overview
This section provides a visual summary of the system’s activity logs, highlighting error occurrences and performance metrics across all integrated booking channels.
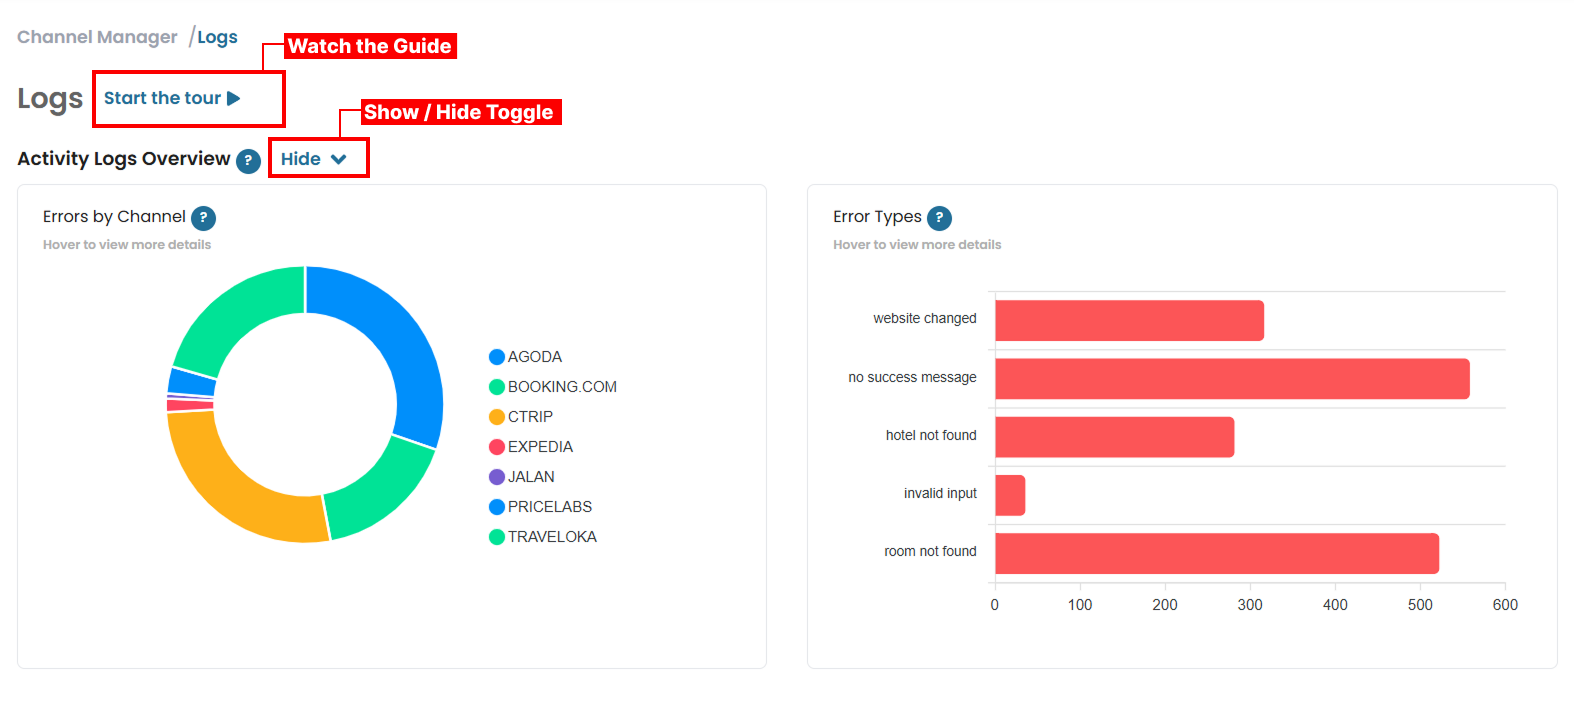
- Click Start the Tour to launch an interactive walkthrough of the Logs page. This tour provides a brief explanation of key functions and navigation options
- Use the Show/Hide Toggle to expand or collapse the Activity Logs Overview section.
- The Pie Chart visualizes the distribution of detected errors categorized by the connected booking channels, helping you quickly identify which channels experience the most issues.
- The Bar Chart displays the classification of common error types encountered during operations.
Activity Logs
The Activity Logs section allows you to monitor all recorded system activities in real time, including successful operations and detected errors for each connected channel.
View and Navigate Logs
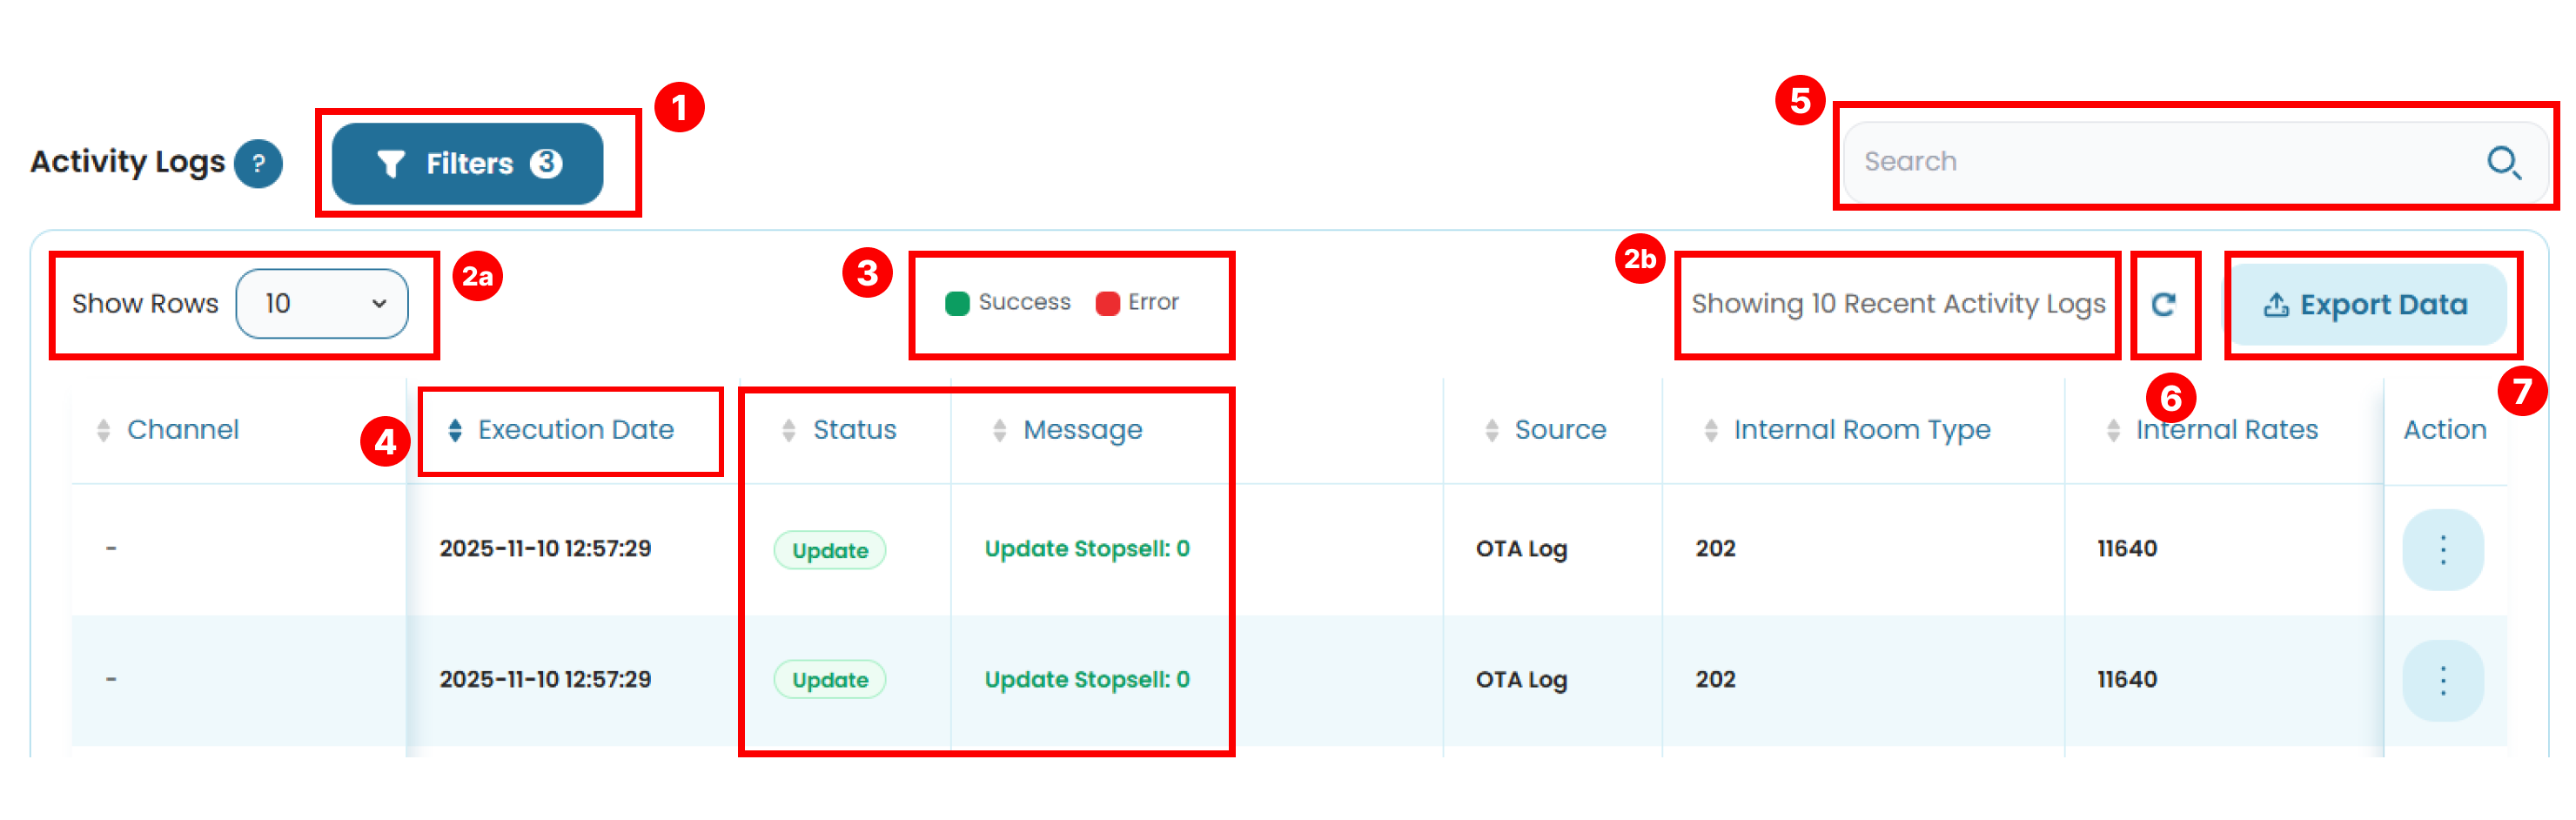
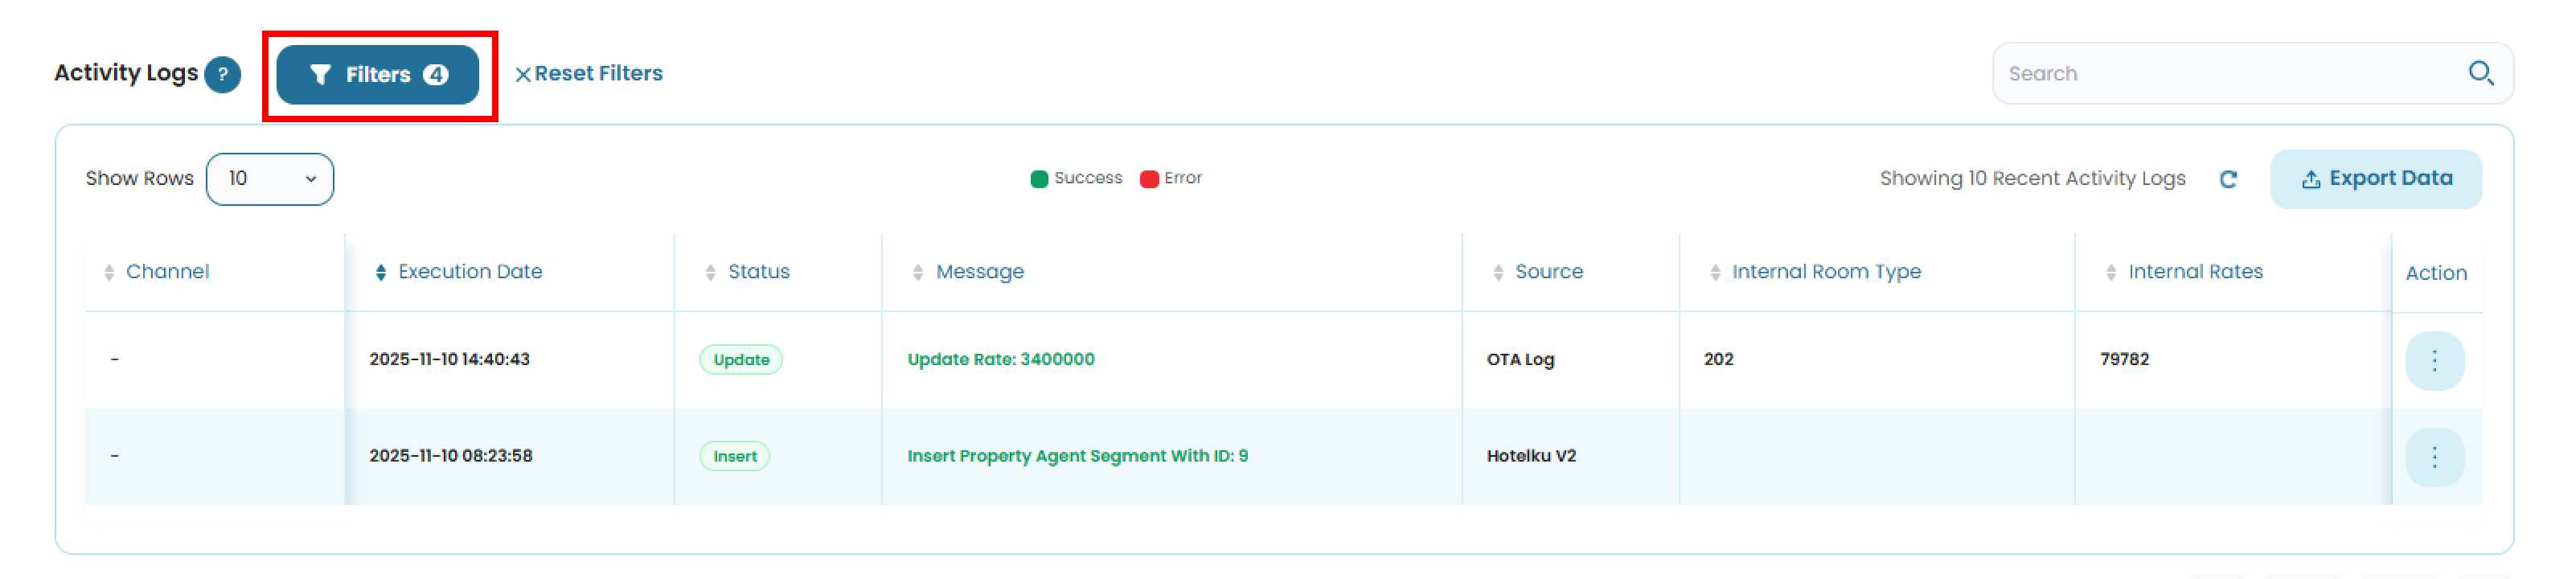
- Click the Filter button to refine the displayed logs based on specific parameters.
- The table can display 10, 20, 50 or 100 rows per page. a. You can adjust this using the Show Rows dropdown. b. The total number of displayed rows will also be shown at the top of the table.
- Log indicator. Each logs is labeled with a color-coded indicator:
- Green: Success. the log was processed successfully.
- Red: Error. There was an issue occurred during the process. These indicators appear on Status and Messages to quickly show the current status of each activity.
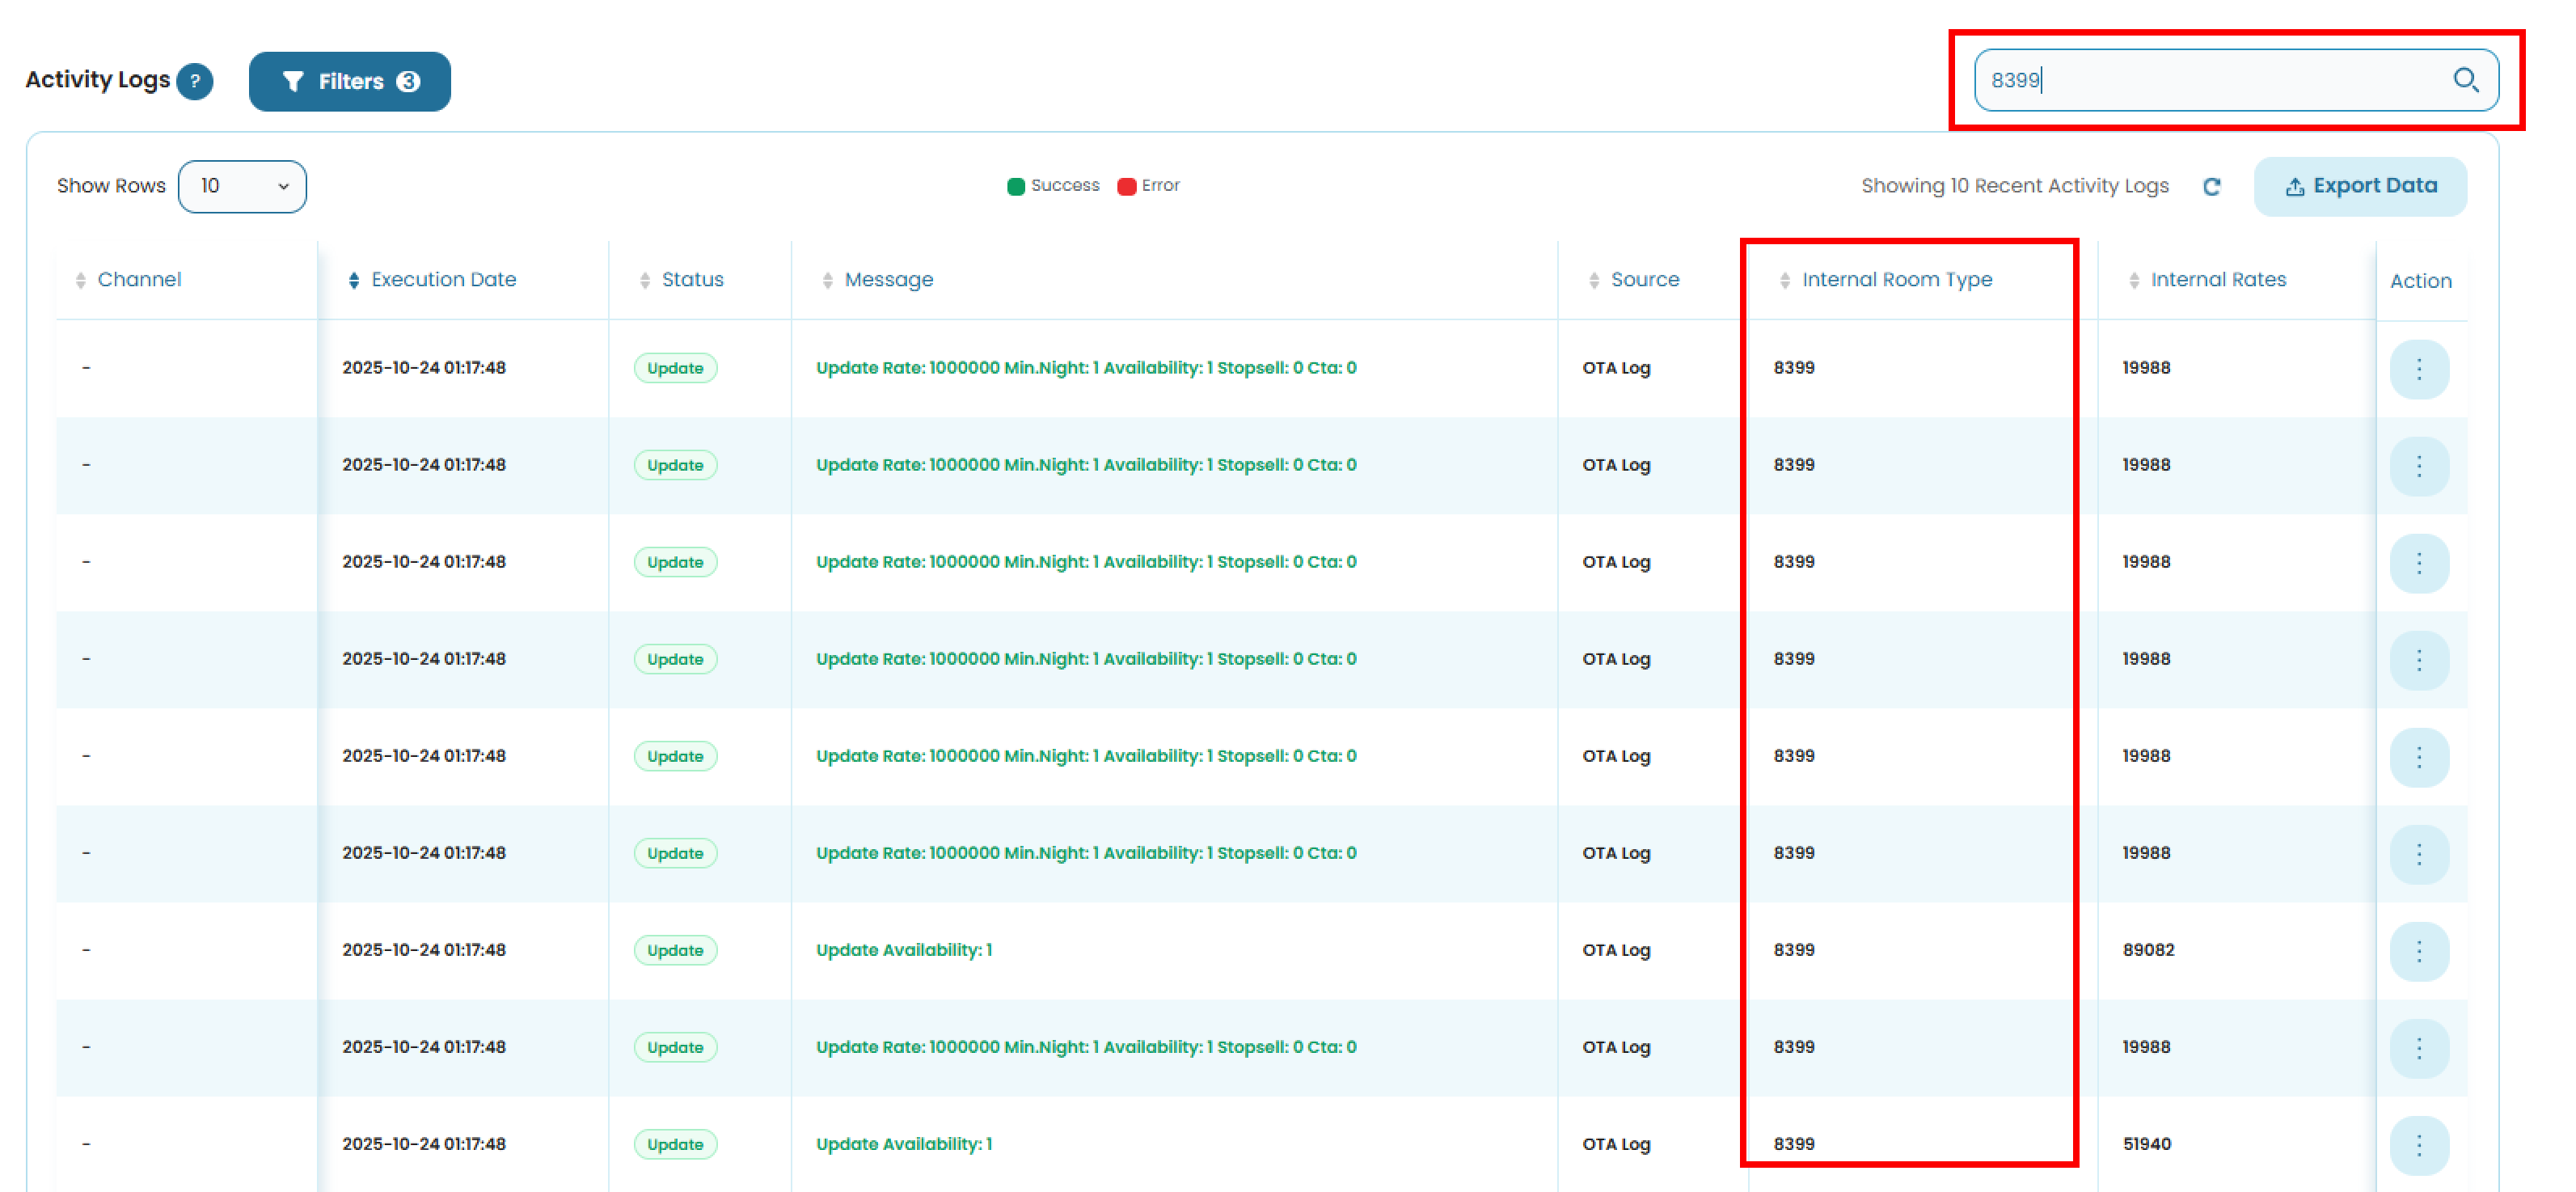
- Columns such as Execution Date, Status, Message, Source, Internal Room Type and Internal Rate, can be sorted by clicking the column headers.
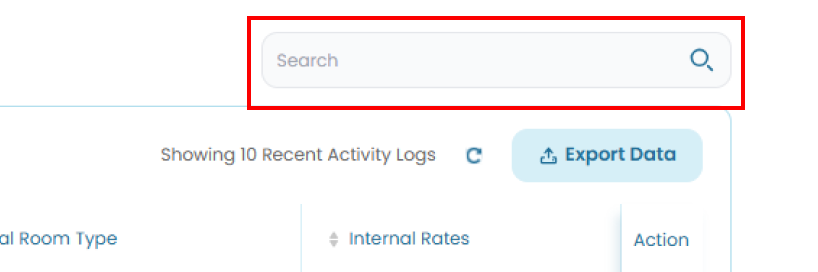
- Use the Search Bar to find specific logs by keywords or values within the table. See Search for more details.
- The Refresh button refreshes the table and resets any applied sorting to the default order.
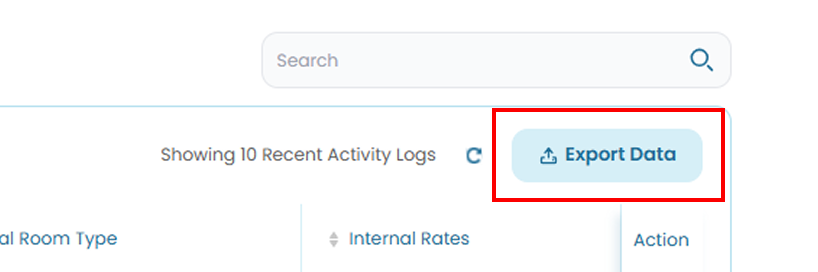
- Click the Export Data button to download the displayed records. See Export for detailed instructions.
View Logs Detail
You can access complete details of any log entry for deeper review
- In the Action column, click the Options (⋮) button and select View Detail.
- A pop-up window will appear displaying the complete log details.

- The information displayed depends on the log source type.
- Click the Open Flat File button to view the related flat file data. A new pop-up window will appear showing the detailed content.
- To close the pop-up window, click the X button at the top or the Close button at the bottom.
Searching Data
The Search bar allows you to quickly find specific logs activity using any keyword or value available in the table.
- Click inside the Search bar.
- Type any keyword based on the data available in the table, including:
- Channel
- Execution Date
- Status
- Message
- Source
- Internal Room Type
- Internal Rates
- The table will automatically filter the results to match your input.
How to Use Logs Filter
By default, the activity logs table only displayed the OTA logs are. You can view others using the filter button.
- Click the Filter button at the top of the Log activity table.
- In the filter panel, you can choose from the following options:
- Date and Time Period
Allows you to filter logs based on a predefined date range (e.g., Today, This Week, Last Month) to quickly focus on specific time periods.
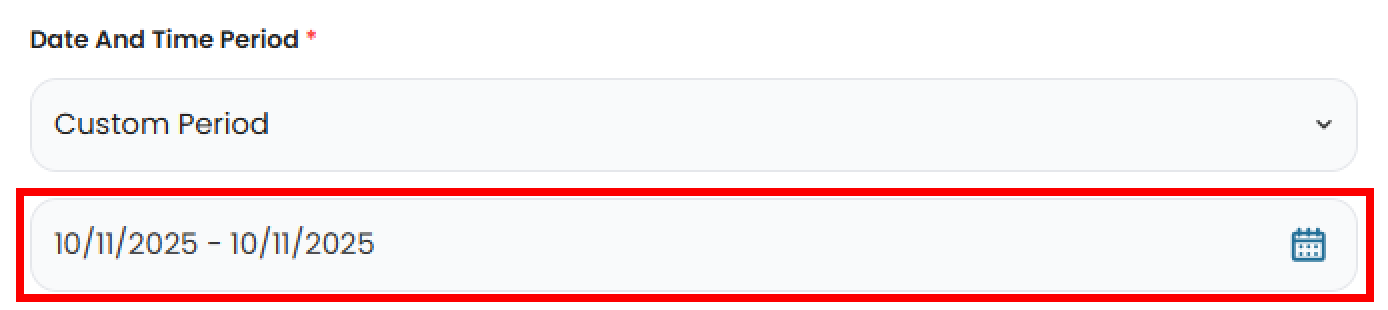
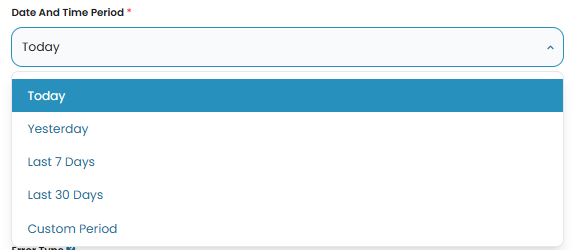 Choosing Custom Period will display a new fields where you can select a specific start and end date to create your own custom date range. The maximum allowed range for a custom period is 90 days
- Start Time and End Time
These fields appear only when you select Today in the Date and Time Period option or when you set a Custom Date covering a single day. When this fields are enabled, you can specify the exact start and end times to display logs that occurred within the selected period.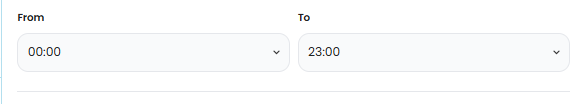
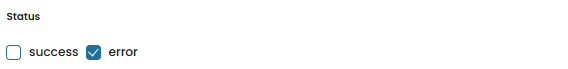
- Status
This filter allows you to display logs based on their processing status. The selected status also determines which options are activated in the Source Field.
- Ticking Success will automatically select all available options, except Process failure in the Source Field.
- Ticking Error will automatically select only Process Failure in the Source Field.
- You can tick both options to display all logs. It will automatically select all available option in the Source Field.
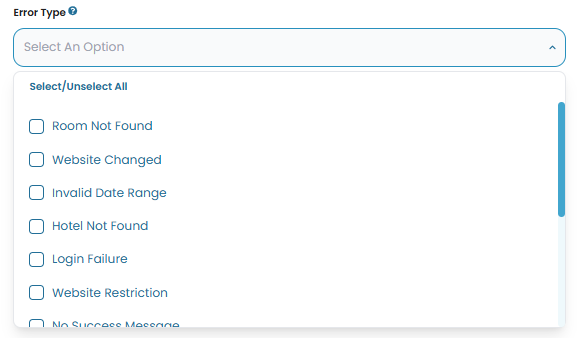
- Error Type
This field is only enabled when Error is the only selected option in the Status filter. If Success is also selected, the field will remain inactive. It allows you to filter logs by the type of error, helping you quickly identify recurring issues or specific failures.
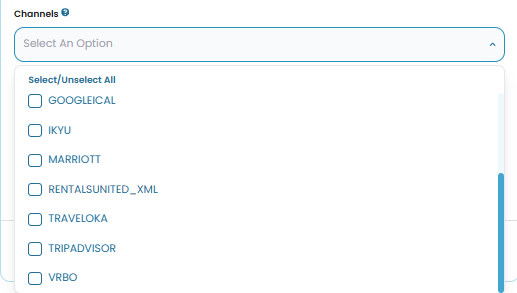
- Channels
The Channel field is enabled only when the selected Source Field includes options that contain a channel column, for example Process Failure, Process Queue, Control Panel and Booking Audit. Once this field is active, you can tick any of the available channels to filter the logs accordingly.
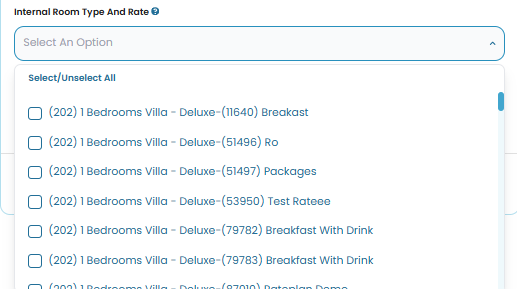
- Internal Room Type and Rate
This field becomes active when you tick OTA Logs or Control Panel in the Source Field. It allows you to filter logs by internal room types and rate plans used in the booking system. This is useful for reviewing updates or identifying errors related to specific room or rate combinations.
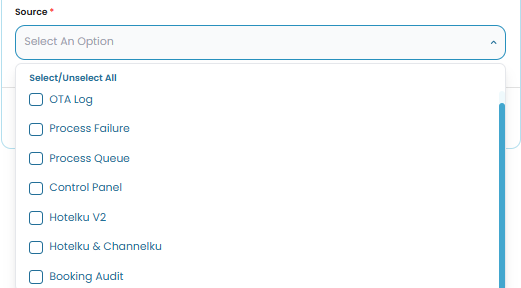
- Source
Filter logs by their system origin, such as OTA Logs, Hotelku, etc.
- Date and Time Period
Allows you to filter logs based on a predefined date range (e.g., Today, This Week, Last Month) to quickly focus on specific time periods.
- At the bottom of the filter panel, you can choose one of the following actions:
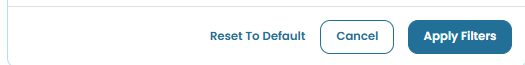
- Reset to default : restores the filter to its default settings.
- Cancel : closes the filter panel without applying changes.
- Apply Filters : applies the selected filter criteria to the logs table.
- Once filters are applied, a Reset Filters button will appear at the top right of the filter section (next to the Filters button).
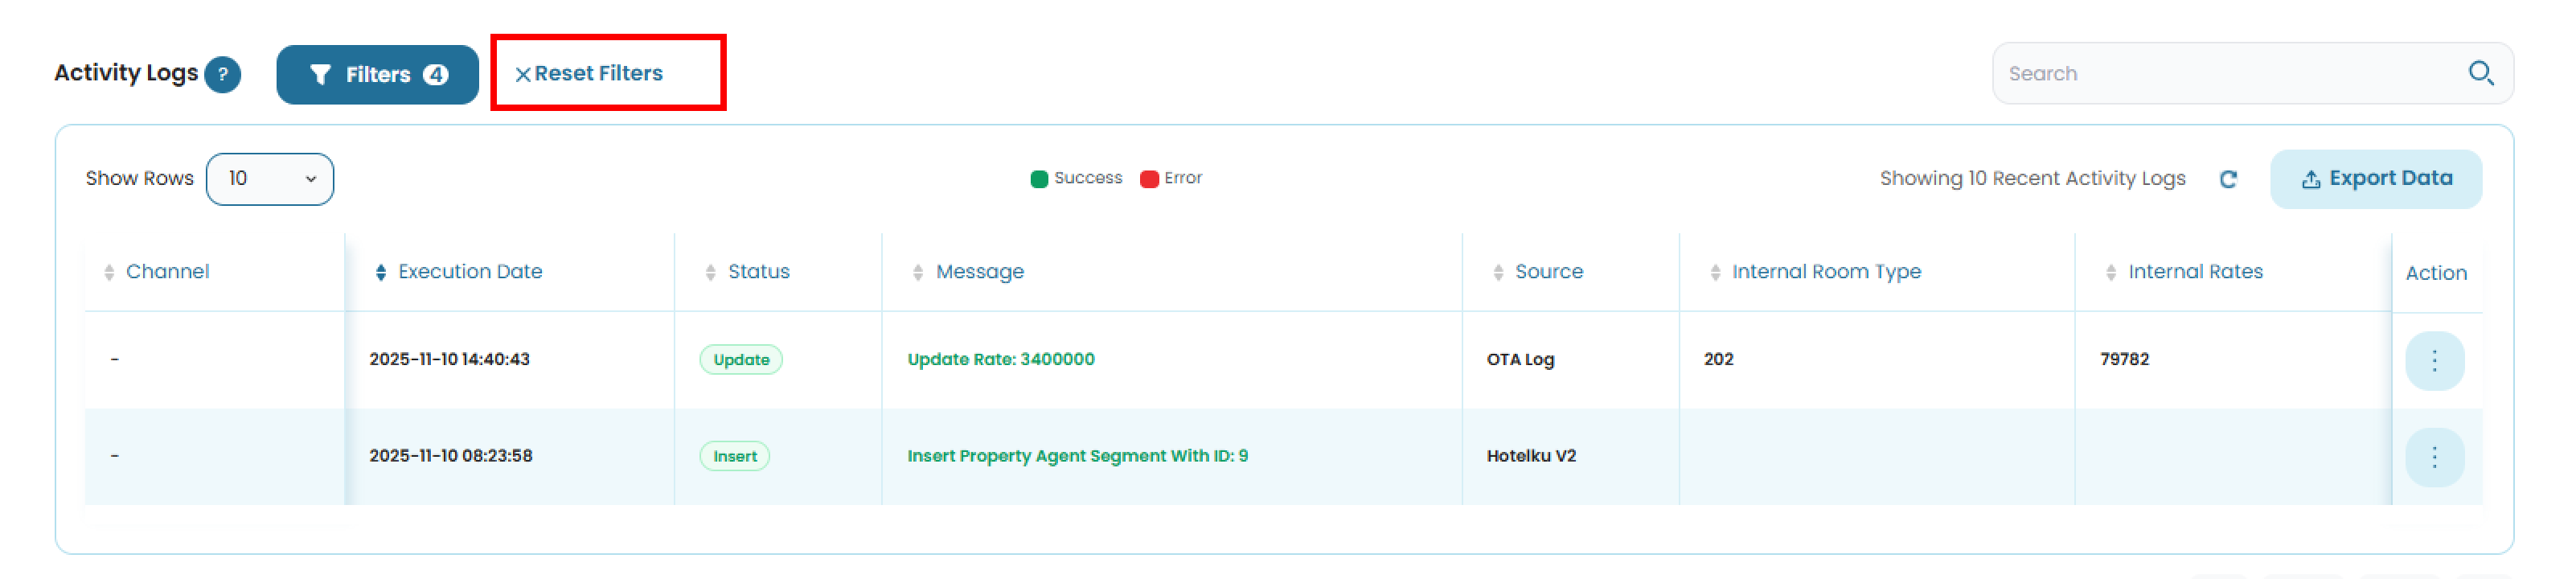
- Click this button to clear all applied filters and return to the default view.
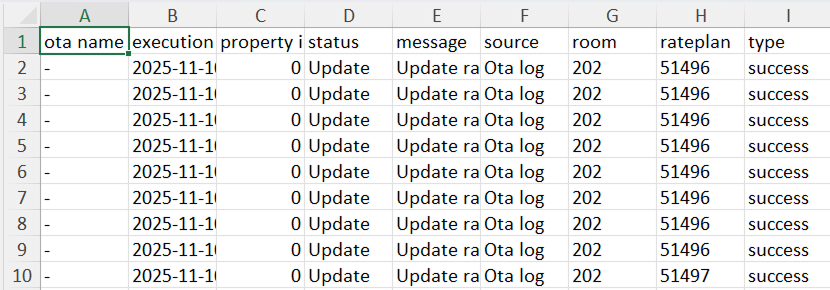
How to Export Data
The Export Data feature allows you to download booking records as a .xlsx file to generating reports, or creating backup. You can export your current logs activity by following these steps:
- Click the Export Data button.
- The export will include all bookings currently displayed, including filtered results.
- The file will be automatically generated and downloaded in .xlsx format.
[!TIP]
Use filters before exporting if you only want to download specific records.